iOS Performance Review
Historical Data — July 2025
The metrics in this document reflect data from the week of June 16–22, 2025, and were reported on July 12, 2025. This data should be treated as historical context only. Before using these figures in investor or executive presentations, obtain current data from App Store Connect Analytics.Executive Summary: The Phenom App — iOS Performance
To: Executive Team From: Phenom Dev Team Date: July 12, 2025 Subject: Project Peregrine - Weekly Performance and Strategy
This summary provides an overview of The Phenom App’s performance on the App Store for the week of June 16–22, 2025, and outlines key metrics for proving market validity to potential investors.
Internal note: “The Phenom App” is the public-facing name. Internally the current app is referred to as Peregrine. The previous generation native app is referred to as Buzzard and is no longer actively developed.
iOS App Store Benchmarks
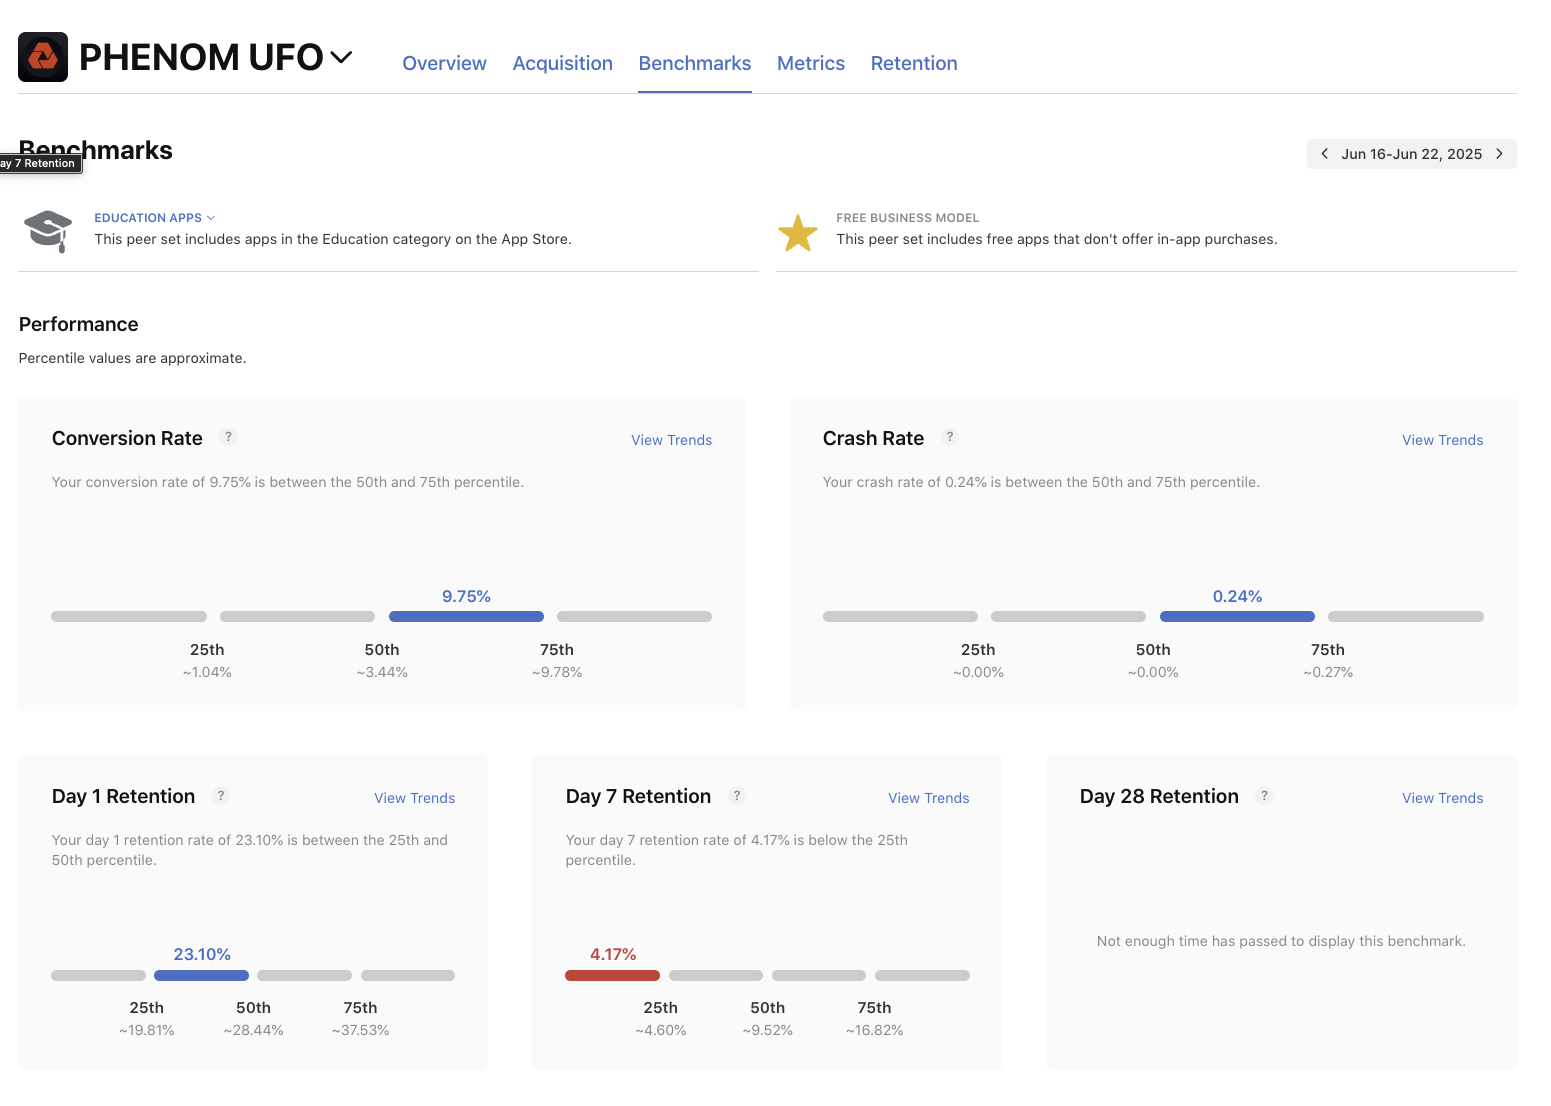
Current Performance Analysis (June 16–22, 2025)
The latest data presents a mixed but clear picture of our app’s current standing in the “Education” category.
Areas of Strength:
- Conversion Rate: 9.75% — This is a strong performance, placing us between the 50th and 75th percentile. Our App Store presence is effectively converting viewers into users, indicating a compelling proposition.
Areas for Immediate Improvement:
- Day 7 Retention: 4.17% — This is a critical concern, as it falls below the 25th percentile. While we are attracting users, we are failing to keep them engaged long-term.
- Day 1 Retention: 23.10% — This metric is also underperforming, sitting between the 25th and 50th percentiles. A significant portion of our users do not return after the first day.
- Crash Rate: 0.24% — Our app’s stability is in the 50th to 75th percentile for crashes, meaning it crashes more often than the median app in our category. This is likely a significant contributor to our poor retention rates.
In short, our marketing and App Store optimization are effective at acquisition, but the user experience is suffering, leading to low retention.
Proving Market Validity to Investors: The “Gold Standard” Metrics
To secure funding for further development, we must demonstrate a valid and growing market for our app. Investors are data-driven and look for proof of a sustainable business. Beyond vanity metrics like total downloads, they scrutinize user engagement and monetization potential. Here are the “gold standard” metrics we must focus on to prove our market validity:
User Retention and Engagement Metrics: These are considered the gold standard in the app industry as they reflect the quality and value of your app.
- Retention Rate (Day 1, 7, 30): This is a primary indicator of user loyalty and the value your app provides. A high retention rate shows that users are incorporating the app into their lives.
- Session Length and Frequency: These metrics reveal how deeply users are engaging with the app. Longer and more frequent sessions signal a product that provides ongoing value.
- Daily Active Users (DAU) and Monthly Active Users (MAU): The ratio of DAU to MAU, often called the “stickiness ratio,” is a key indicator of habitual use. A strong ratio signals a loyal user base.
Product and Performance Metrics:
- Crash Rate: A low crash rate is fundamental to a positive user experience and, consequently, to retention.
- Feature Adoption Rate: This metric shows which features are resonating with users and providing the most value.
Monetization and Growth Metrics: For free apps, engagement is a proxy for future revenue potential.
- User Growth Rate: A consistent increase in new users demonstrates market traction.
- Customer Lifetime Value (LTV): This metric projects the total revenue a single user will generate over their time with the app.
By focusing on improving our retention and crash rates, we can build a stronger case for the long-term viability and market potential of The Phenom App to investors.
Feedback
Was this page helpful?
Glad to hear it! Please tell us how we can improve.
Sorry to hear that. Please tell us how we can improve.